Financial Accounts of the United States - Z.1
Recent Developments RSS Data Download
The recent developments discussed below refer to data through December 31, 2024.
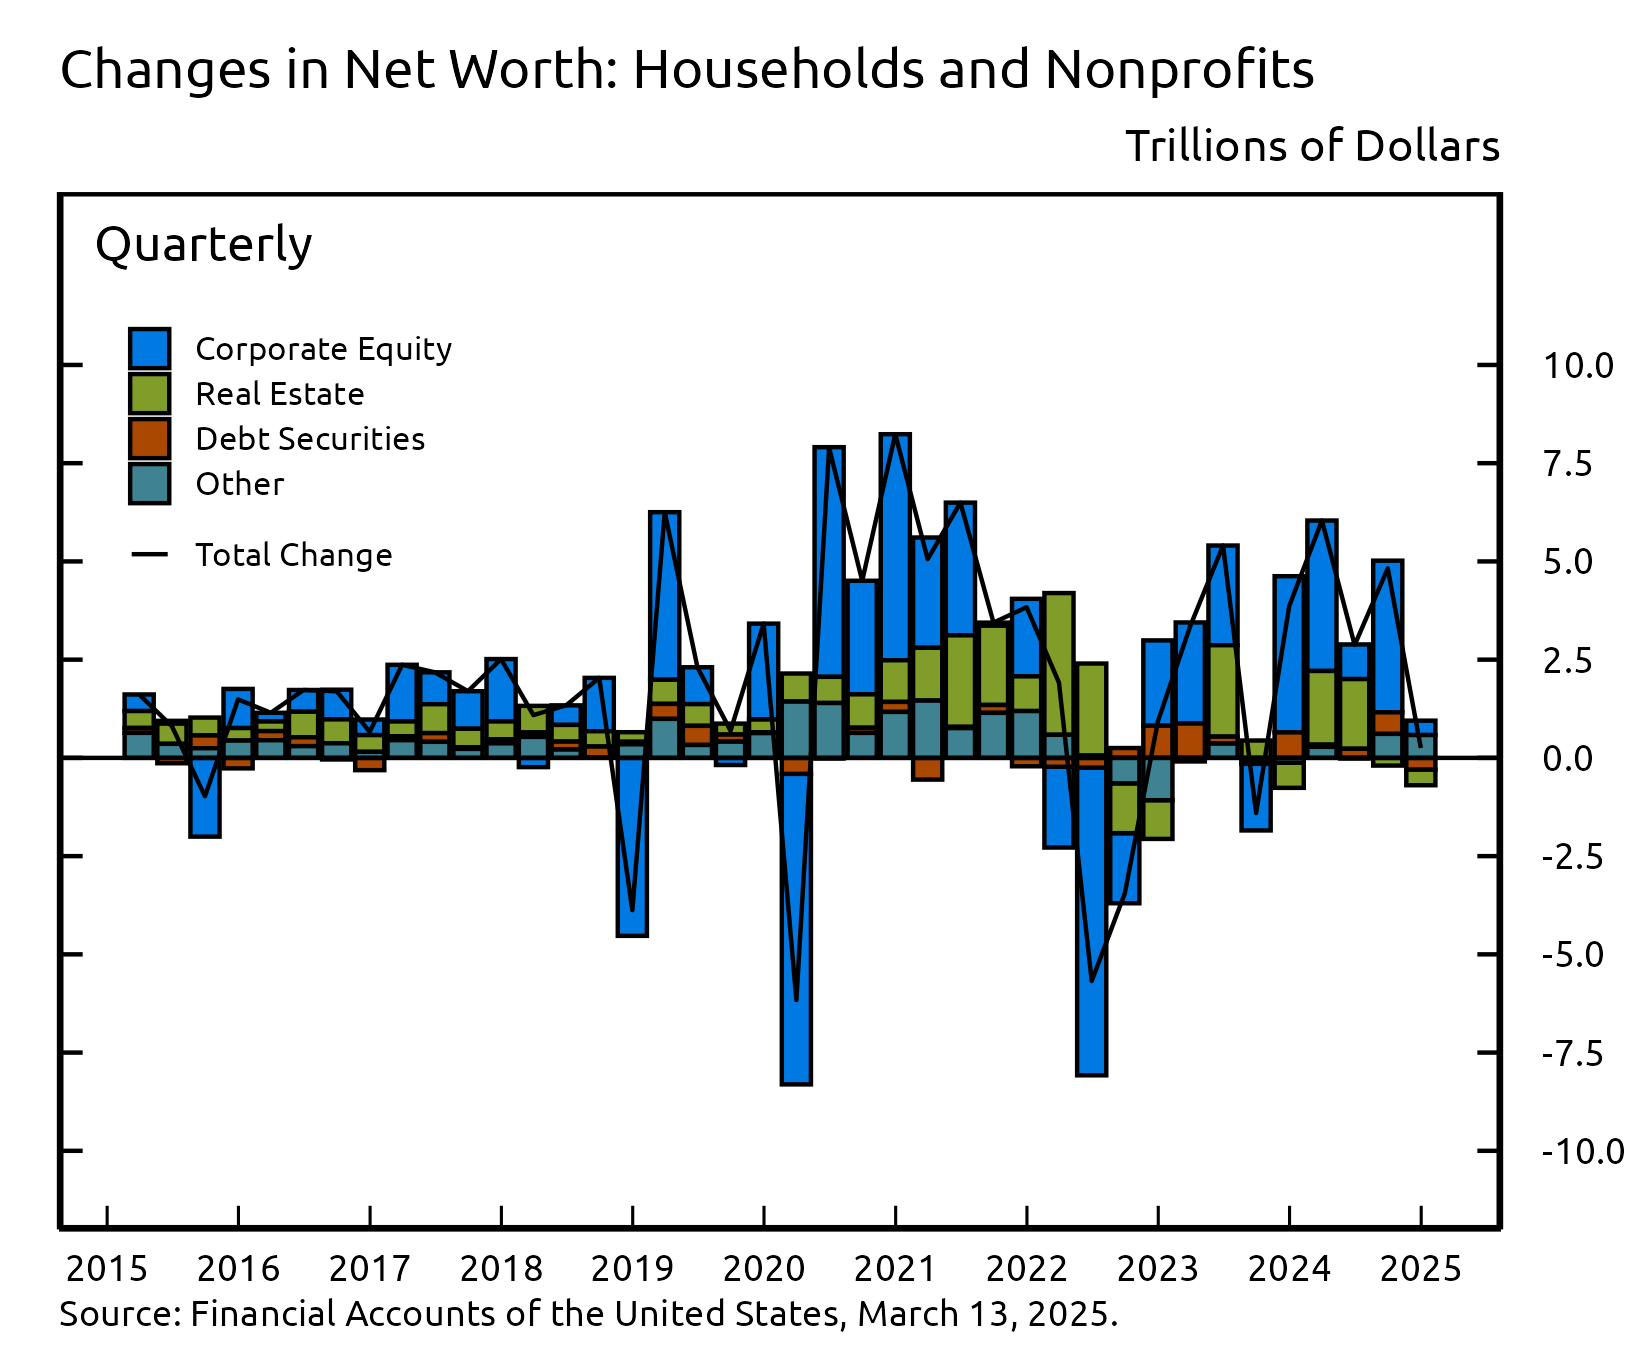
- Household net worth increased by $0.2 trillion in the fourth quarter of 2024, reflecting modest gains on corporate equity assets and declines in the value of real estate and debt securities.
- Household debt increased at a seasonally adjusted annual rate of 3.1% in the fourth quarter amid slightly slower growth of mortgage debt and steady growth of nonmortgage consumer credit.
- Nonfinancial business debt expanded 1.0% at a seasonally adjusted annual rate in the fourth quarter, as the net retirement of debt securities was more than offset by growth in mortgage loans and other nonmortgage loans.
Household Net Worth
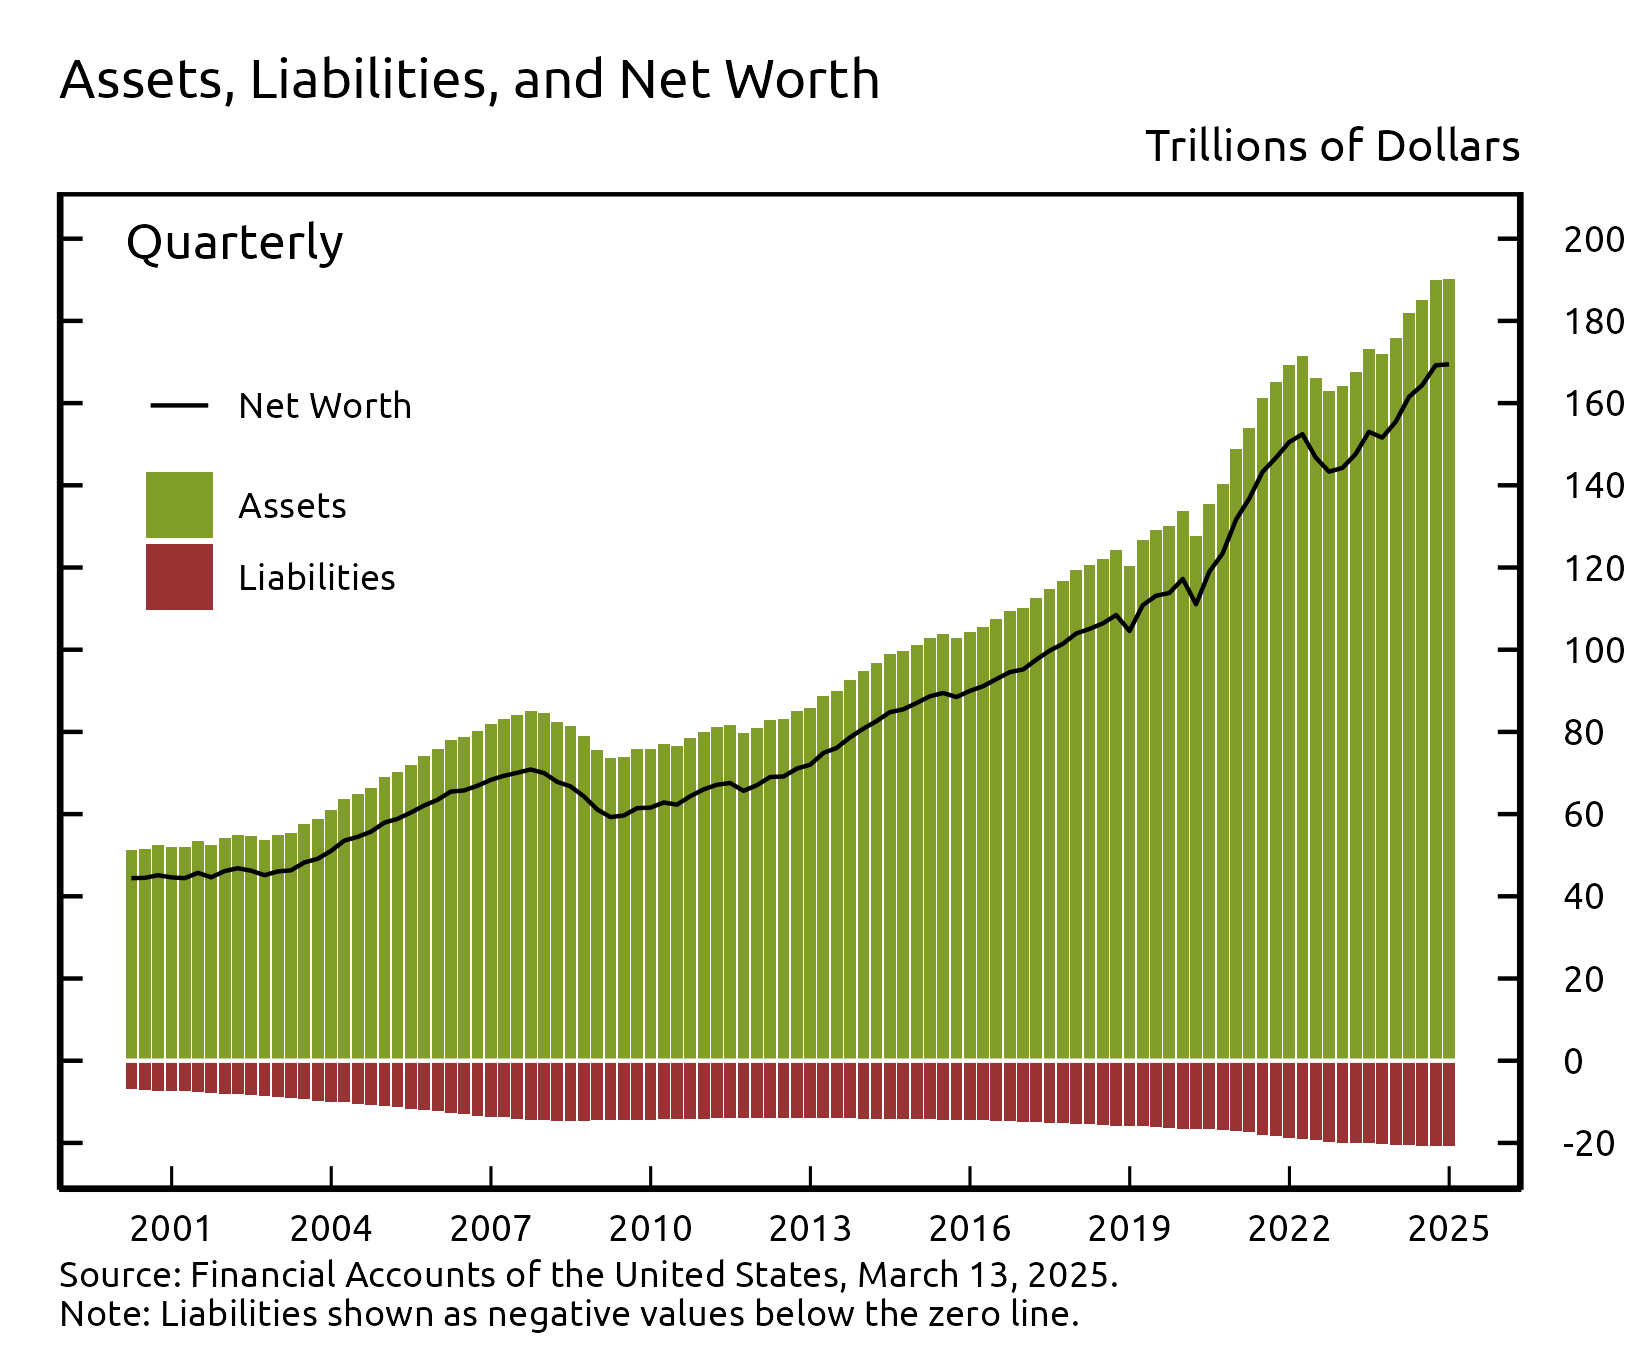
The net worth of households and nonprofit organizations increased by $0.2 trillion to $169.4 trillion in the fourth quarter. This relatively small change in household net worth reflects some offsetting changes in the holdings of different assets that make up household portfolios. The value of directly and indirectly held equity on the household balance sheet increased by $0.3 trillion in the fourth quarter, while the value of directly and indirectly held debt securities declined by $0.3 trillion. The value of real estate held by households declined by $0.4 trillion.
View interactive | Accessible version | CSV | Data Dictionary | Chart Note (1) |
Directly and indirectly held corporate equities ($56.0 trillion) and household real estate ($48.1 trillion) remain the largest components of household net worth.
View interactive | Accessible version | CSV | Data Dictionary |
Household Balance Sheet Summary
| Description | 2023 | 2024 | 2024:Q1 | 2024:Q2 | 2024:Q3 | 2024:Q4 |
|---|---|---|---|---|---|---|
| Net Worth | 155.46 | 169.36 | 161.50 | 164.37 | 169.20 | 169.36 |
| Change in Net Worth | 11.22 | 13.90 | 6.04 | 2.87 | 4.82 | 0.16 |
| Equities | 47.19 | 56.02 | 51.02 | 51.90 | 55.76 | 56.02 |
| Change in Equities | 7.39 | 8.83 | 3.83 | 0.88 | 3.86 | 0.26 |
| Real Estate | 44.91 | 48.06 | 46.89 | 48.69 | 48.47 | 48.06 |
| Change in Real Estate | 2.31 | 3.16 | 1.99 | 1.80 | -0.22 | -0.41 |
For more data on household net worth, see table B.101
Nonfinancial debt
Household debt grew by 3.1% in the fourth quarter of 2024, about the same as the previous few quarters (this and subsequent rates of growth are reported at a seasonally adjusted annual rate). Home mortgage debt expanded by 2.2% and nonmortgage consumer credit grew by 2.6%.
Nonfinancial business debt expanded at a 1.0% pace in the fourth quarter, a noticeable step down in growth relative to the first three quarters of 2024. This slowdown was mainly driven by a contraction in nonfinancial corporate debt, as net retirements of debt securities were only partially offset by tepid growth in mortgage loans and other nonmortgage loans. Nonfinancial noncorporate business debt growth picked up a bit in the fourth quarter, owing to solid growth in both mortgage loans and other nonmortgage loans.
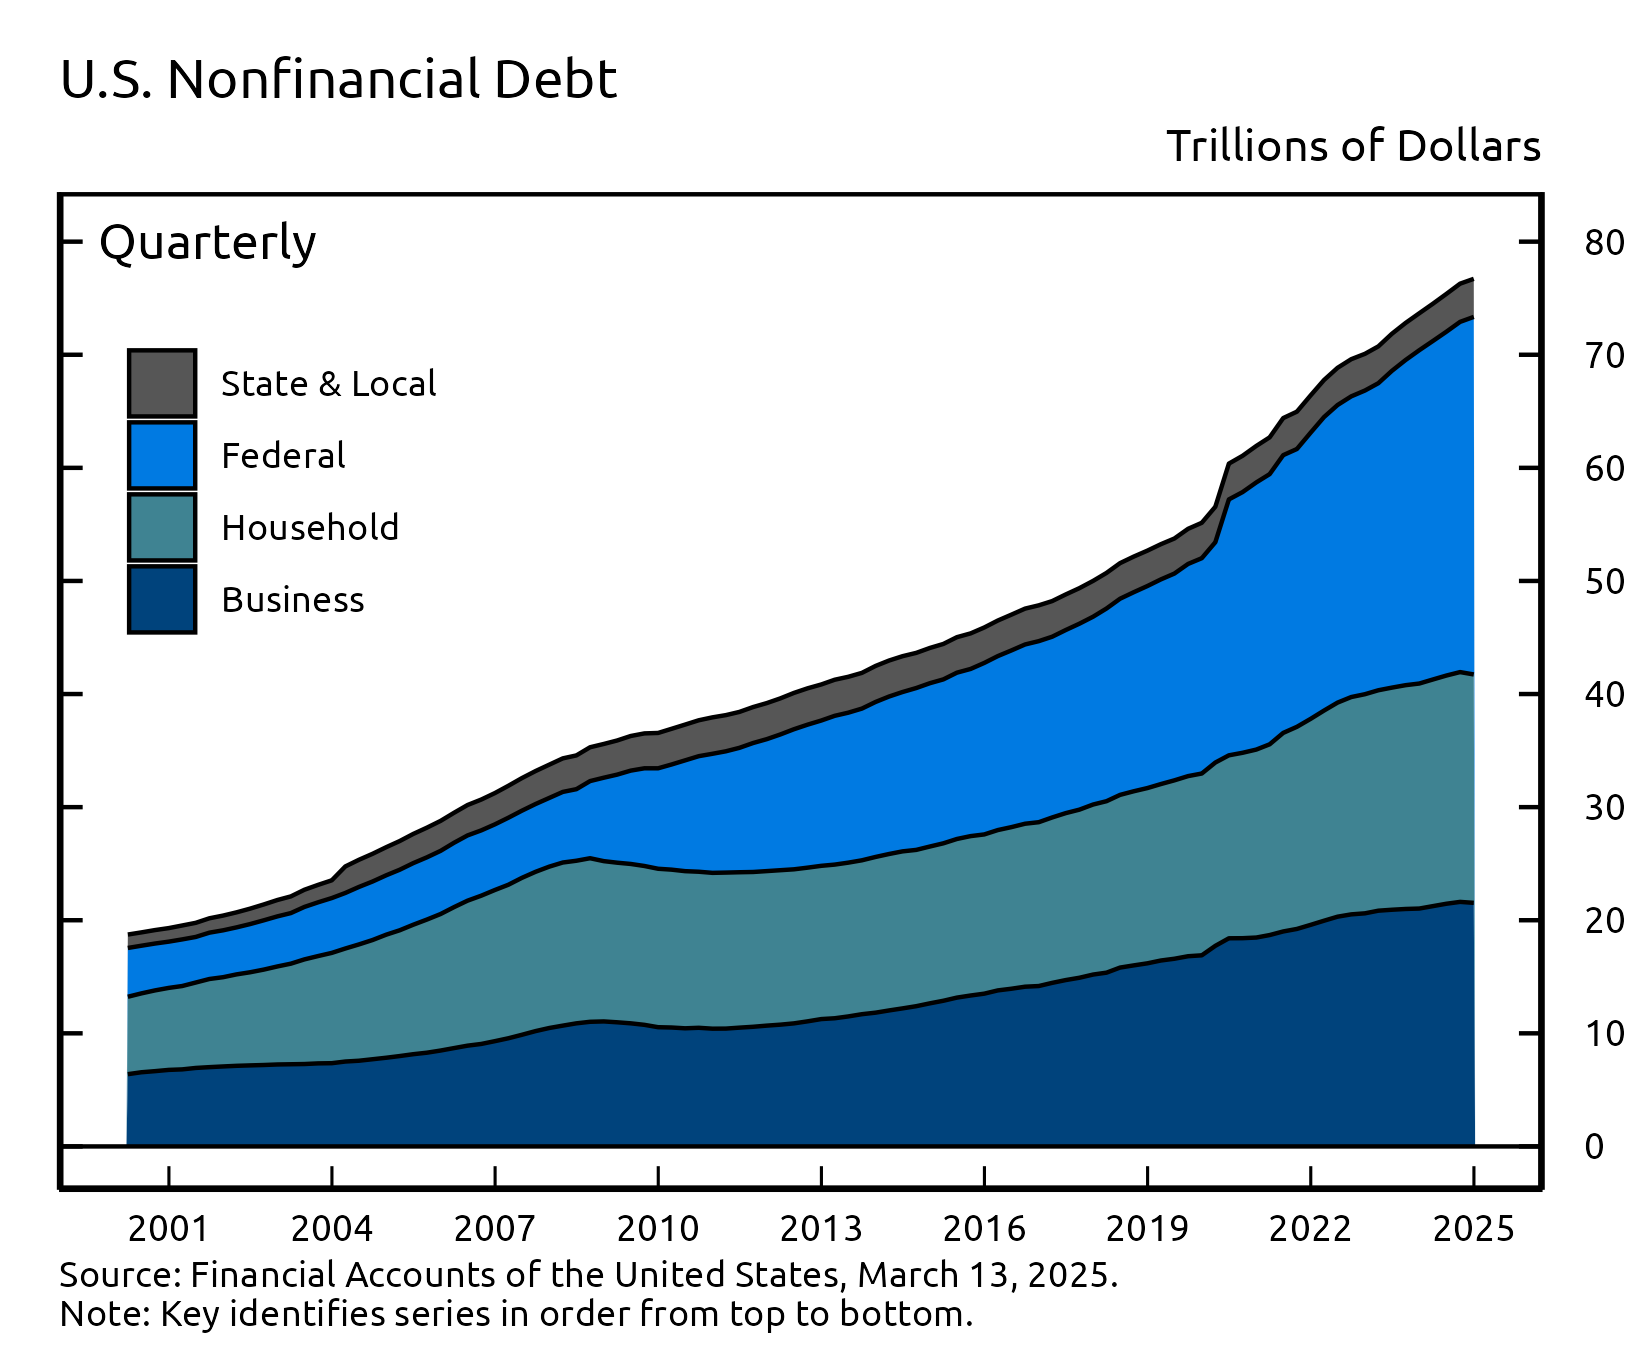
Overall, domestic nonfinancial debt grew at an annual rate of 4.4% in the fourth quarter, about in line with the first three quarters of 2024, but still somewhat weaker than the average pace recorded over the previous few years. Federal government debt increased at an 8.4% pace, while state and local government debt contracted at an annual rate of 1.4%.
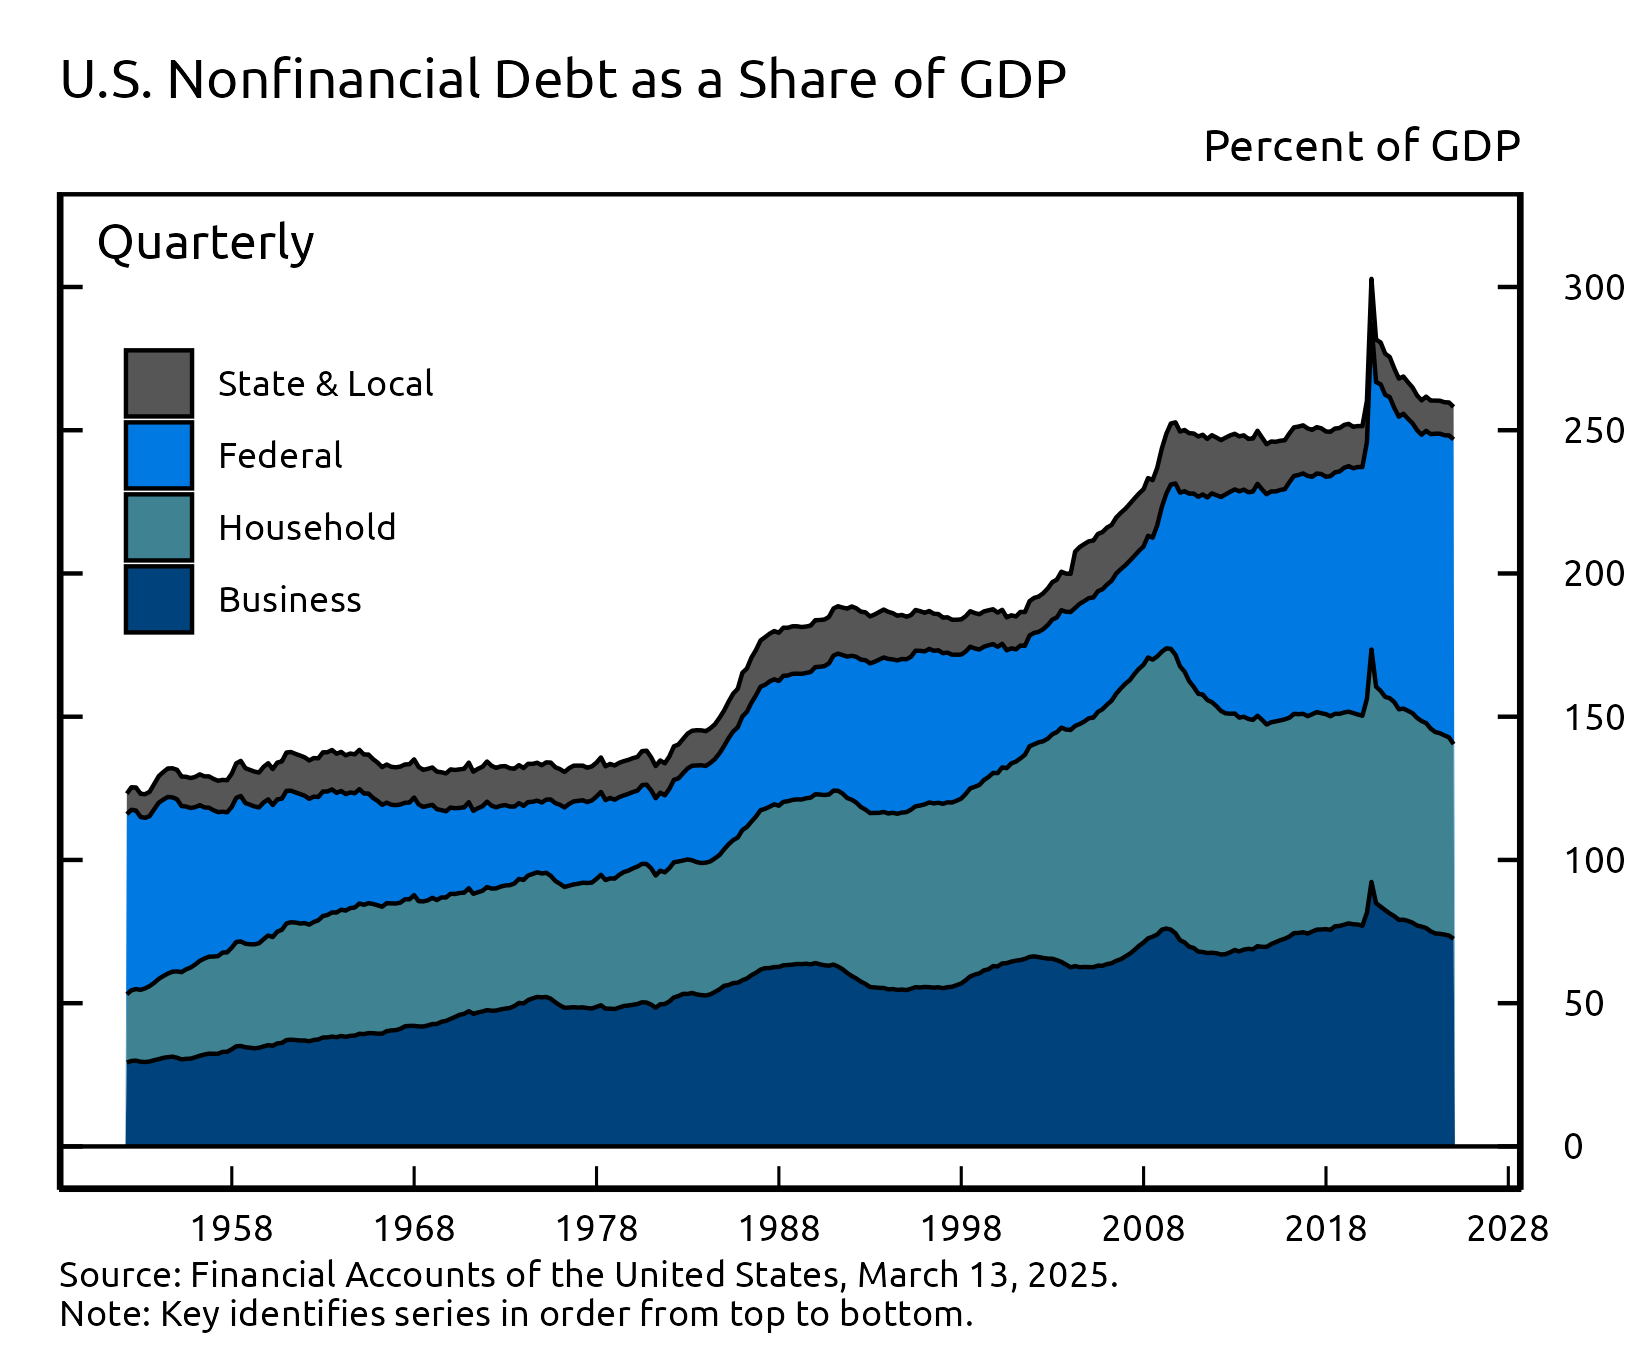
Total domestic nonfinancial debt outstanding (seasonally adjusted) was $76.7 trillion in the fourth quarter, of which household debt was $20.2 trillion, nonfinancial business debt was $21.6 trillion, and total government debt was $35.0 trillion. The ratio of nonfinancial debt outstanding to GDP in the fourth quarter was 258%, about the same as in recent quarters. For more data on nonfinancial debt, see table D.1 (rates of debt growth), table D.2 (borrowing), and table D.3 (debt outstanding).Debt Growth by Sector
| Description | 2023 | 2024 | 2024:Q1 | 2024:Q2 | 2024:Q3 | 2024:Q4 |
|---|---|---|---|---|---|---|
| Total Nonfinancial | 5.13 | 4.71 | 4.55 | 4.69 | 4.81 | 4.45 |
| Households and Nonprofits | 2.71 | 2.92 | 2.87 | 2.79 | 2.83 | 3.07 |
| Nonfinancial Business | 2.06 | 3.06 | 4.06 | 4.01 | 3.05 | 0.97 |
| Federal Government | 9.76 | 7.28 | 6.20 | 6.31 | 7.44 | 8.41 |
| State and Local Governments | 0.70 | 2.99 | 3.10 | 5.98 | 4.16 | -1.36 |
Debt Outstanding by Sector
| Description | 2023 | 2024 | 2024:Q1 | 2024:Q2 | 2024:Q3 | 2024:Q4 |
|---|---|---|---|---|---|---|
| Total Nonfinancial | 73.67 | 76.73 | 74.51 | 75.38 | 76.28 | 76.73 |
| Households and Nonprofits | 19.90 | 20.20 | 20.04 | 20.18 | 20.32 | 20.20 |
| Nonfinancial Business | 21.03 | 21.55 | 21.25 | 21.46 | 21.62 | 21.55 |
| Federal Government | 29.47 | 31.62 | 29.93 | 30.40 | 30.97 | 31.62 |
| State and Local Governments | 3.27 | 3.37 | 3.29 | 3.34 | 3.38 | 3.37 |
Accessible version | CSV | Data Dictionary |
Accessible version | CSV | Data Dictionary |
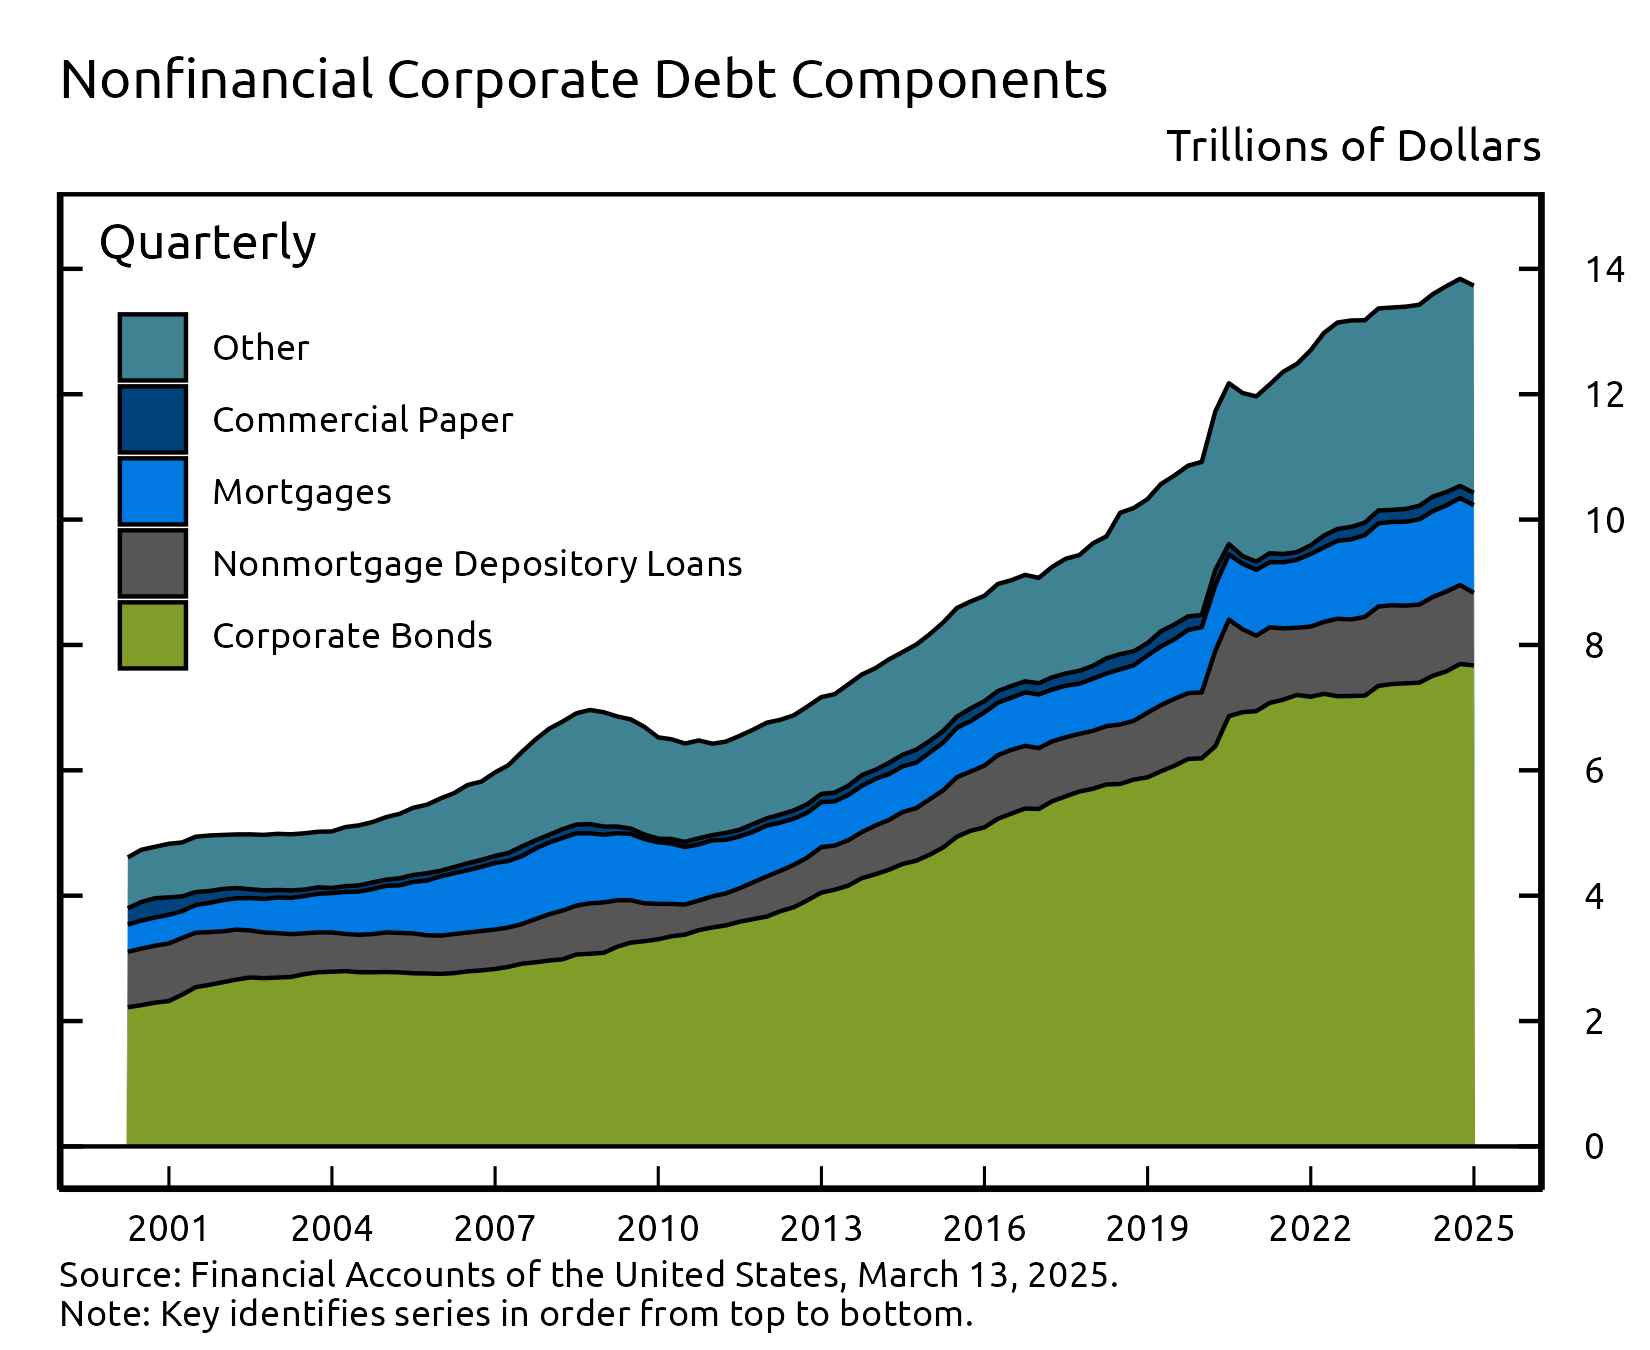
Looking at the components of nonfinancial business debt, corporate bonds decreased by about $24 billion in the fourth quarter while mortgage loans increased by $71 billion. Commercial paper outstanding rose modestly by about $5 billion while nonmortgage loans at depository institutions increased by about $29 billion. Other nonbank nonmortgage loans rose by $13 billion in the fourth quarter.
Outstanding nonfinancial corporate debt was $13.7 trillion. Corporate bonds, at roughly $7.7 trillion, accounted for 56% of the total debt. Mortgage loans were about $1.4 trillion, while nonmortgage depository loans were approximately $1.2 trillion. Other types of debt include loans from nonbank financial institutions, loans from the federal government, industrial revenue bonds, and commercial paper.
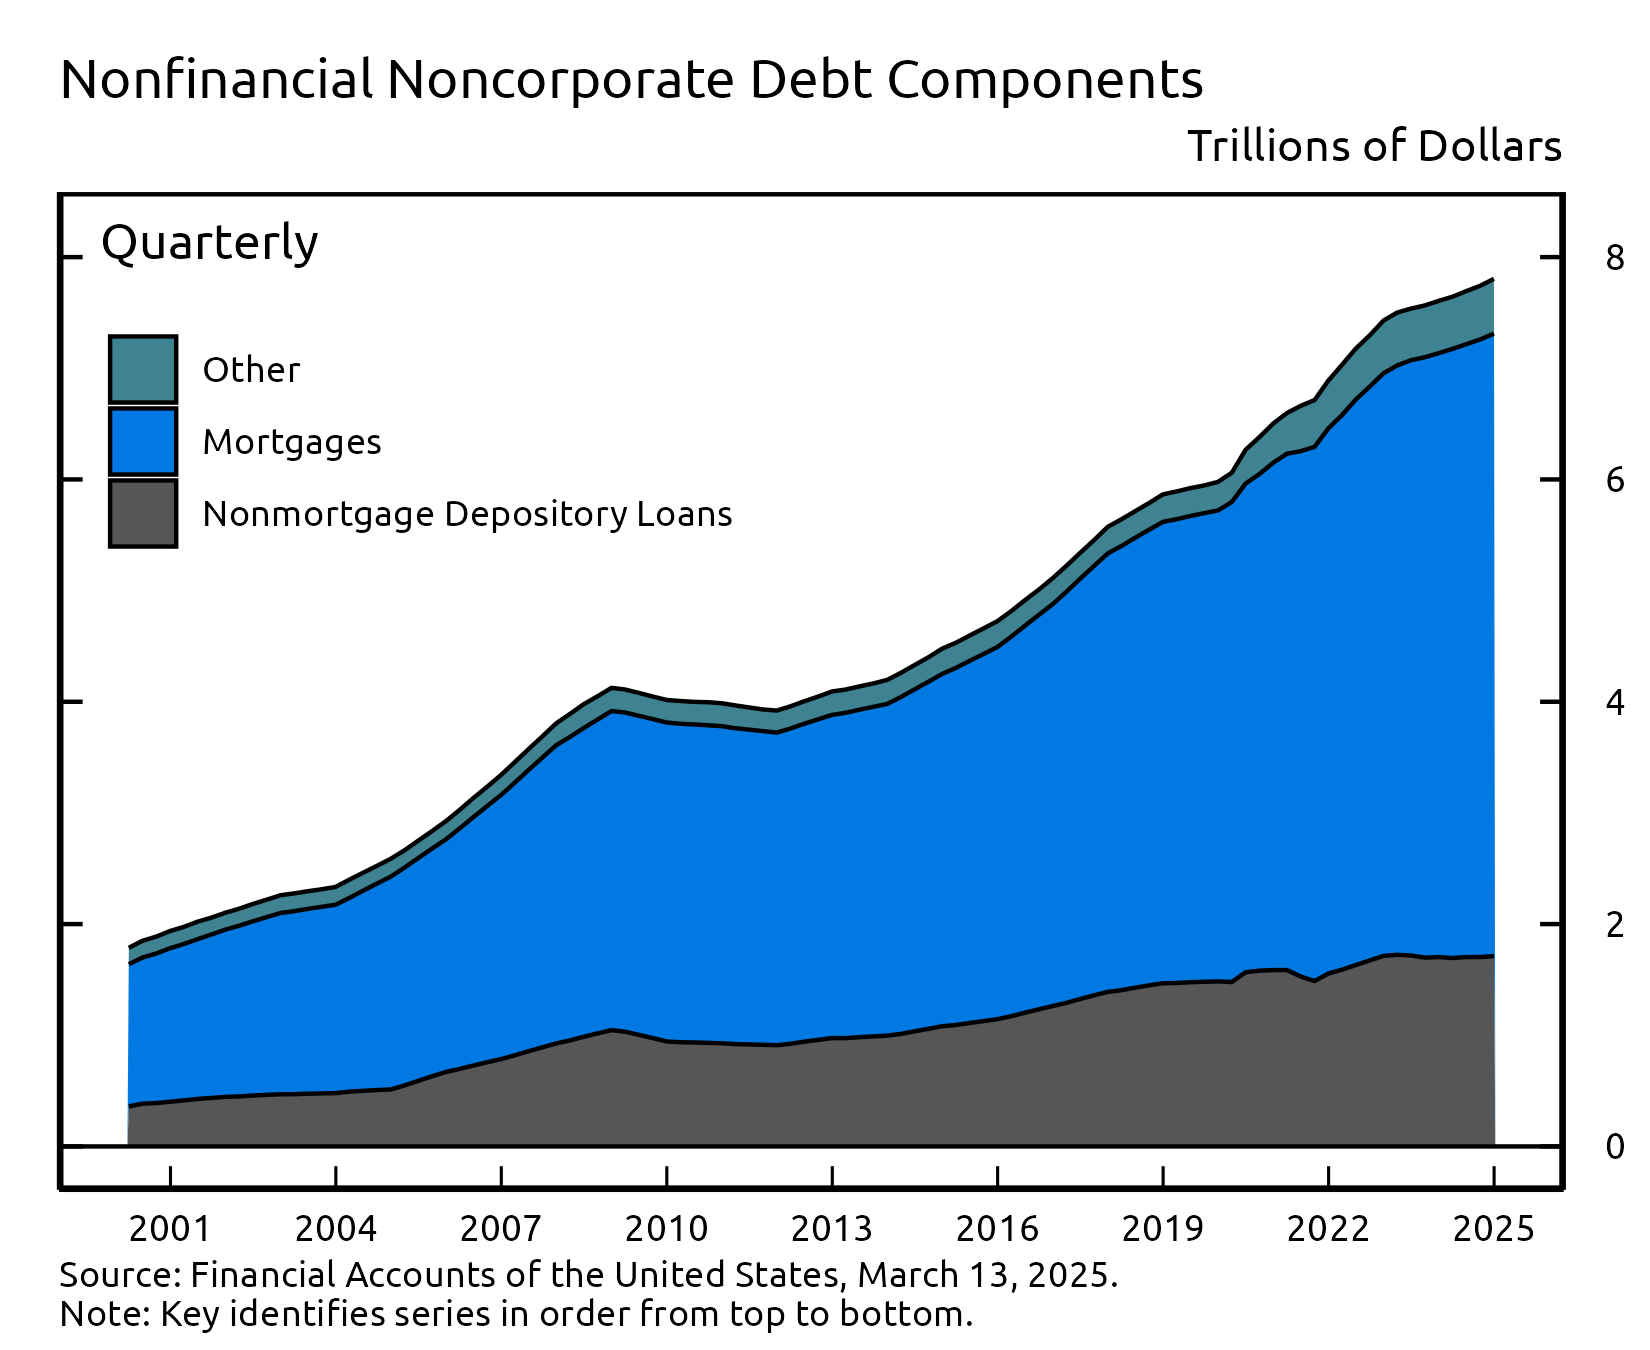
The nonfinancial noncorporate business sector consists mostly of smaller businesses, which are typically not incorporated. Nonfinancial noncorporate business debt was $7.8 trillion in the fourth quarter. Mortgage loans, at roughly $5.6 trillion, accounted for about 72% of the total, while nonmortgage depository loans ($1.7 trillion) accounted for most of the remainder.
Accessible version | CSV | Data Dictionary |
Accessible version | CSV | Data Dictionary |
For more data on nonfinancial business balance sheets, including debt, see tables B.103 and B.104.
Coming soon
- Enhanced
Financial Accounts Projects will be updated on Friday,
March 21, 2025, including the Distributional Financial
Accounts, which provide a quarterly estimate of the
distribution of U.S. household wealth.
- Financial Accounts data for the first quarter of 2025 will be published on Thursday, June 12, 2025, at 12:00 noon.
Chart Notes
- Changes in net worth consist of transactions, revaluations, and other volume changes. Corporate equity and debt securities include directly and indirectly held securities. Real estate is the value of owner-occupied real estate. Other includes equity in noncorporate businesses, consumer durable goods, fixed assets of nonprofit organizations, and all other financial assets apart from corporate equities and debt securities, net of liabilities, as shown on table B.101 Balance Sheet of Households and Nonprofit Organizations.